
ARCHIVES OF CLINICAL TRIALS AND CASE REPORTS
Neonates Extended New Ballard Score and Parkin Score Comparison for Gestational Age Assessment
Venugopal Reddy I1*, Pavan Kumar Yaramsetty2 and Vijayashankara CN3
1Medical Director and Consultant Paediatrician, Ovum Hospital, Bangalore, India
2Paediatrician, PES Medical College, Andhra Pradesh, India
3Professor of Paediatrics, PES Medical College, Andhra Pradesh, India
*Corresponding Author: Venugopal Reddy I, Medical Director and Consultant Paediatrician, Ovum Hospital, Bangalore, India.
| ReceivedMar 6, 2023 | RevisedMar 13, 2023 | AcceptedMar 15, 2023 | PublishedApr 3, 2023 |
Abstract
This study aims to estimate the gestational age in neonates admitted to NICU and postnatal wards within the first 24 hours of life using Parkin score. All newborns had their ENBS and PS Scores calculated, and the appropriate GA listed in the chart was assigned.
After gathering the aforementioned data, comparisons were done between other sets of data, including the correlation between LMP/USG and ENBS, LMP/USG and Parkin score, ENBS and Parkin score, and the time required for ENBS and PS.
The gestational age ranged from 27 to 42 weeks, while the Parkin's score ranged from 1 to 12. The condition, birth weight, and maturity of the infants were evaluated. Parkin score with GA determined by LMP/USG has a Pearson correlation of zero for healthy and ill newborns.
The Pearson connection between PS and gestational age as determined by LMP/USG is zero for newborns with AGA, LGA, and SGA. For term and preterm neonates, the LMP/USG-estimated Pearson correlation for PS with GA is 0. The average deviation from LMP, as measured by Parkin Score, was 9 or 10.
5 days, 11 days for babies with AGA, LGA, and SGA. The average deviation from LMP for Preterm, Full Term, and Post Terms, respectively, was 12 days, 8 days, and 9 days while taking PS's definition of maturity into account. Parkin's Score is therefore simple to administer, especially in neonates who are ill, requires little time, and is simple to teach other paramedical workers.
Keywords
New borns; Postnatal wards; Gestational age; Pearson correlation; Parkin score; Neonates
Introduction
Knowledge of newborn babies Gestational age (GA) may modify the care given, the risks of morbidity and mortality, and help in risk categorization and prognostication. It becomes necessary to evaluate the GA of newborns with illnesses. They are sensitive to even the smallest alteration in their regimens of medicine and intravenous maintenance fluid, for example [1,2]. The GA typically calculates based on the mother's most recent menstrual cycle. In some pregnancies, this date is not known with certainty. Some receive false information, such as those with irregular menstruation or those who used oral contraceptives just before conception.
The common methods for assessment of GA 1. the New Ballard Score (NBS) [2]. Parkinscore (PS), proposed in 1991 and 1976 respectively. Most widely used in most neonatal units in the world is the Expanded New Ballard Score (ENBS).
ENBS includes both physical and neuromuscular characteristics making it up in no small scoring system. It may not be possible to do the complete assessment in many instances, particularly in neuromuscular assessment in sick newborns or on ventilator support, and require minimum handling [3,4].
Parkin's scoring system has been in use since the mid-1970s [5]. It had extensively used until 1990s when ENBS replaced it. The drawback of ENBS is that it cannot be applied in all sick neonates if the assessment usually becomes partial.
Parkin's scoring system is the simplest one it can be assessed on all neonates, normal or sick, with very minimal handling and less time. Only four exterior characteristics-skin texture, colour, ear firmness, and breast size-are used in Parkin's score (PS).
There is no requirement for a specialist to evaluate the Parkin score. Healthcare professionals in primary care and secondary care settings, such as community health centres and local hospitals, can perform this task [6].
What is a gestational age (GA) assessment?
GA, also known as menstrual age or menstrual dating, is calculated in whole weeks starting from the mother's LMP date.
The estimated date of a term delivery, or estimated day of confinement (EDC), is determined by multiplying the LMP by one year and seven days, then taking three months away. The Naegele's rule calculation assumes that ovulation takes place two weeks following the LMP [7,8].
The estimated date of ovulation, also known as the fetus's ovulatory age or fertilization age, is two weeks earlier than GA as determined by the LMP. Embryologists routinely use the foetus' ovulatory age.
1. Based on gestational age, neonates are classified as
- Preterm <34 weeks gestation
- Late pre-term: 34 to <37weeks
- Term: 37 to 42weeks
- Post term: 42 weeks and beyond
2. Based on birth weight, neonates are classified as
- LBW (low birth weight) <2500gms
- VLBW (very low birth weight) <1500gms
- ELBW (extreme low birth weight) <1000gms
3. Based on age percentiles, neonates are classified as
- AGA (Appropriate for gestational age: 10th to 90th percentile
- SGA (Small for gestational age) :<10thpercentile0
- LGA (Large for gestational age) :>90thpercentile41.
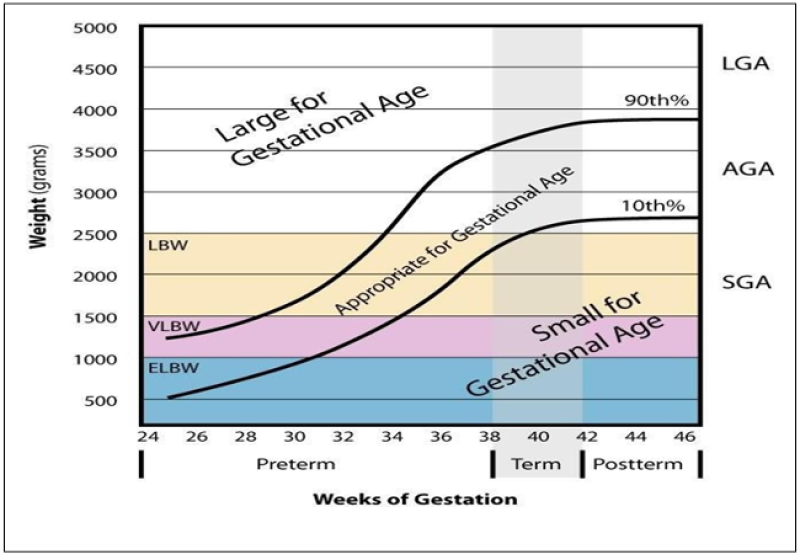
Figure 1: Classification According to Weeks of Gestation.
Methods of postnatal Assessment Lmp/Usg Scan
A 28-day cycle and specific mother knowledge of LMP are required for accurate menstruation dating, which is thought to be accurate to within two weeks. Naegele's rule, a straightforward technique for pregnancy dating, continues to be a recognized norm for determining GA and EDD [9,10] when maternal history is trustworthy. By subtracting three months from the LMP and adding seven days, the EDD is determined. Prenatal sonography can also be used to estimate EDD if it is done before 22+0 weeks of gestation [11]. However, accurate menstrual dating and results from sonography performed before 22+0 weeks of gestation may not be available especially in resource-limited areas. In these cases, gestational age is determined postnatally based on physical examination and neuro muscular assessment.
Dubowitz method [12]
Prior to the creation of the NBS, the Dubowitz approach was widely applied [13]. physical and neurological tests are included in the updated Dubowitz grading system. They are broken down into six areas (tonality, tonal patterns, reflexes, motions, aberrant symptoms, and behaviours), and each is given a score based on a score sheet with instructions and pictures. More maturity is indicated by higher scores. To determine the gestational age, the scores are totaled, and the sum is then shown on a graph. With infants older than 34 weeks of gestation, the physical markers enable gestational age discrimination. Between 26 and 34 weeks, when physical differences are less obvious, the neurologic criteria must be met. The neurologic criteria must be met in the period of 6 to 8 months when physical dissimilarity is low.
There are two drawbacks to the Dubowitz system.
• Its overestimation of GA in premature newborns is one drawback. The Dubowitz examination underestimated the gestational age (GA) by 2.8 weeks in a study of 110 preterm infants with a mean gestational age of 28.3 weeks determined from the LMP and best obstetric estimate.
• The method's second drawback is the number of criteria that must be evaluated, making it challenging to use on unwell or very premature infants and taking 15 to 20 minutes to complete.
Ballard method [3]
It was given by Dr. Jeanne L Ballard in November 1979. The Ballard system shortened the Dubowitz method to depend upon six physical and six neurologic criteria. The examination is most reliable when it is performed within 42 hours of age. Similar to the Dubowitz method, the scores of each feature are added to calculate a maturity rating that correlates with GA and is accurate within two weeks. This simplified assessment can be accomplished more quickly than can the Dubowitz method and is, therefore, easier to perform on sick infants.
Expanded New Ballard score [4]
The Ballard system was modified as the NBS in September 1991 to improve assessment of infants as preterm as 20 weeks. This method expands the description of physical and neurologic features and was tested in infants between 20 to 44 weeks gestation. Correlation was similar, the examination was done up to 96 hours of age in neonates of 26 weeks gestation but is best if done prior to 12 hours in neonates less than 26 weeks.
| Original ballard score | New ballard score |
| Scores ranged from 5 to 50 | Scores ranged from-10 to 50 |
| 26-44 weeks | 20-44 weeks |
| Inaccurate in extremely preterm | More accurate |
| Score starts with 0 | Starts with-1 |
| Optimal age for maturational assessment: Between
30 and 42 hours of age. | Birth to 96 hours (Validated upto 7th
PND in Mod Pre terms) |
| Eyes: not included | Included |
Table 1: Old and New Ballard Score.
Literature & studies on nbs [14]
For neonates <26 weeks of GA, the most validity (97% within 2 weeks of CGLMP) was seen when the examination was done before 12 hours of life. Up till day 7, ENBS is a trustworthy and valid clinical method for GA assessment. From 22 to 28 weeks GA by accurate menstrual history, NBS estimations were 1.3 to 3.3 weeks out of date. While caring for severely premature children, especially when deciding whether to forgo or provide intensive care, it is important to take into account any inaccuracies in GA as established by the NBS. To maximise the clinical impact, GA grading systems need to be improved. Physical criteria are less trustworthy than neurological criteria.
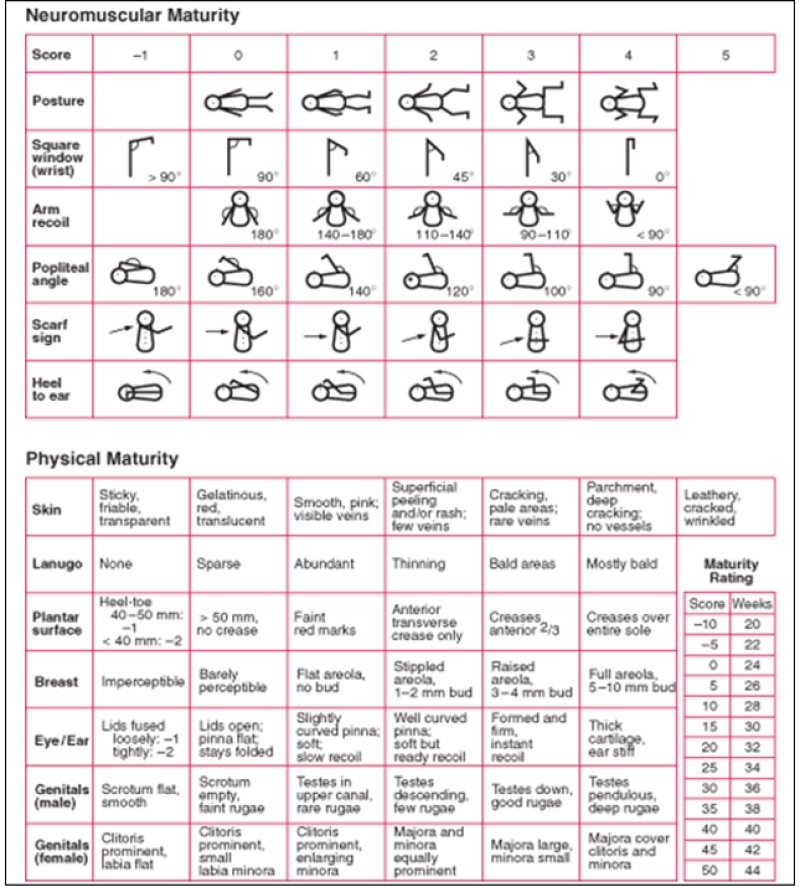
Figure 2: Expanded New Ballard Score [11].
Rapid assessment of GA
Over the years, some investigators have shown that using a few, select physical or neurological elements of the Ballard (or Dubowitz) method correlates well with LMP, early ultrasound, or the full Dubowitz/Ballard exam [15] for quick estimation of gestational age. This method has also proven beneficial when less experienced healthcare providers are tasked with estimating gestational age.
Eye examination [16]
• The disappearance of the anterior vascular capsule of the lens occurs in an orderly manner between 27- and 34-weeks’ gestation [17].
• As a result, examination with a direct ophthalmoscope after dilation of the pupil can be used to estimate gestational age.
Electroencephalography [12]
A characteristic developmental sequence of electroencephalographic patterns occurs with increasing post conceptual age appearing at 21 to 22 weeks.
• As an example, in a study of neonates born at less than 27 weeks gestation, continuous EEG patterns increased, and immature EEG findings decreased with increasing age.
• Although this method is not used clinically, patterns of regional and hemispheric electrical activity that appear at specific times during maturation used to estimate gestational age.
• EEG and ultrasound or anatomic assessment of GA are highly correlated.
• In infants <30 weeks gestation who subsequently died, the EEG correlated better than did the Ballard score with neuropathologic assessment of sulcal-gyral development. The maturational progression of EEG background activity occurs at the same rate in the fetus or preterm infant.
Postnatal foot length
• Within the first 24 hours of life, foot lengths were measured using a plastic Verniere's sliding calliper.
• The method of measuring is simple to teach and uses inexpensive, readily available equipment, making it appropriate for a low-resource context.
Disadvantages of this method is a lack of ethnical representivity.
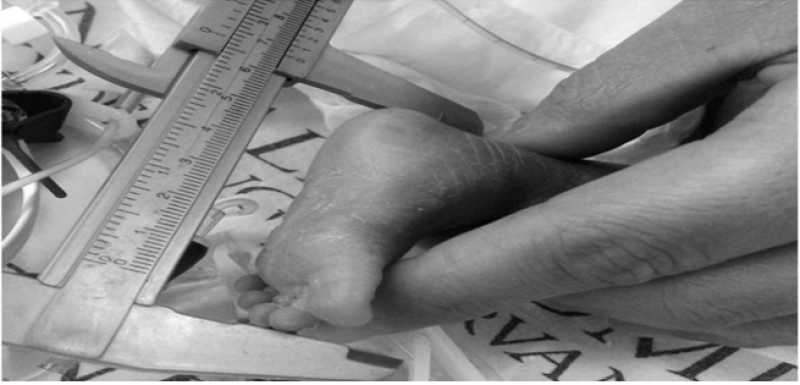
Figure 3: Foot Length Assessment Using Verniere Scaliper.
Parkin score [5]
Parkin JM, Hey EN, Clowes JS, et al., (1976) in Archives of Disease in Childhood, 51,259 mentioned about a tool for Rapid assessment of gestational age (GA) at birth. The gestational age can be determined to within 15 days (95% confidence limits) at any point in the first two days of life using a straightforward scoring system based on skin color, skin texture, breast development, and ear firmness that can be used even on sick babies without manipulation or movement.
Development of a predictive score [18]
Evaluation of the relative deficiencies and strengths of the individual traits leads to the following conclusions:
Compared to the exterior traits, the bulk of neurological symptoms do not connect with gestational age as strongly.
Compared to exterior parameters, neurological ratings typically display worse interobserver agreement and are more influenced by postnatal age. Skin tone, ear firmness, breast size, plantar skin creases, and skin texture are the "best" physical traits, with the last two showing a strong correlation.
It is evident that some of the traits, both exterior and neurological, are unlikely to have a significant impact on a determination of the baby's GA, either because their link with GA is weak or due to other drawbacks. Several linear regressions were computed for various combinations of parameters, and the 95% confidence limits of these lines were compared to ascertain the relative accuracy of estimations of gestational age using various combinations of criteria. A regression line with 95% confidence limits of 18 days is produced when the four best physical characteristics-skin color, skin texture, breast size, and ear firmness-are used. Limiting the measures used to exterior qualities has benefits because neurological tests are more upsetting to the newborn and more susceptible to illness. Considering the evidence, we only recommend using the average of the four qualities' values [18,19].
| Score | Gestational Age in Days | Gestational Age in Weeks |
| 1 | 190 | 27 |
| 2 | 210 | 30 |
| 3 | 230 | 33 |
| 4 | 240 | 34.5 |
| 5 | 250 | 36 |
| 6 | 260 | 37 |
| 7 | 270 | 38.5 |
| 8 | 276 | 39.5 |
| 9 | 281 | 40 |
| 10 | 285 | 41 |
| 11 | 290 | 41.5 |
| 12 | 295 | 42 |
Table 2: Mean Gestational Ages Derived from the Total Scores of Skin-colors, Skin texture, Ear firmness, Breast size.
Skin texture

Figure 4: Term baby.
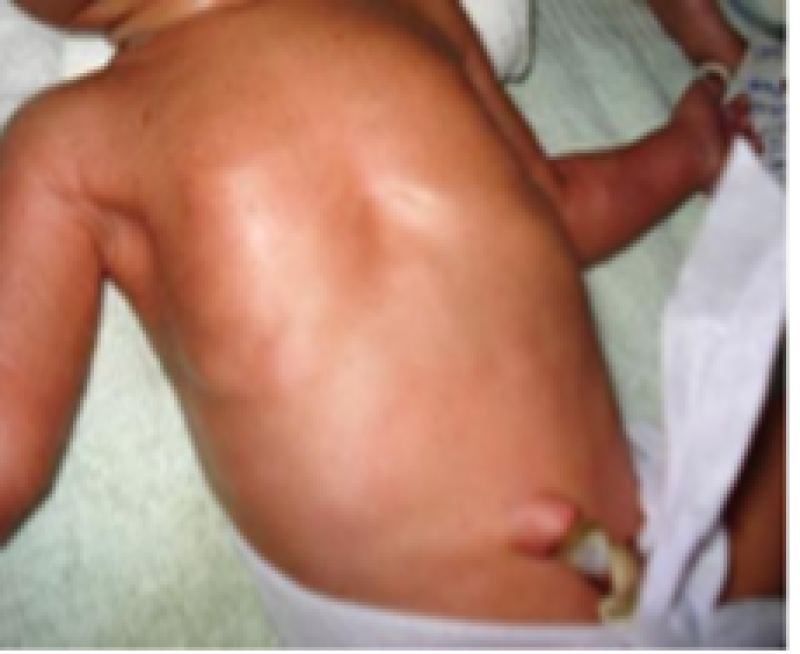
Figure 5: Preterm baby.
Lanugo

Figure 6: Term baby.

Figure 7: Preterm baby.
Plantar surface
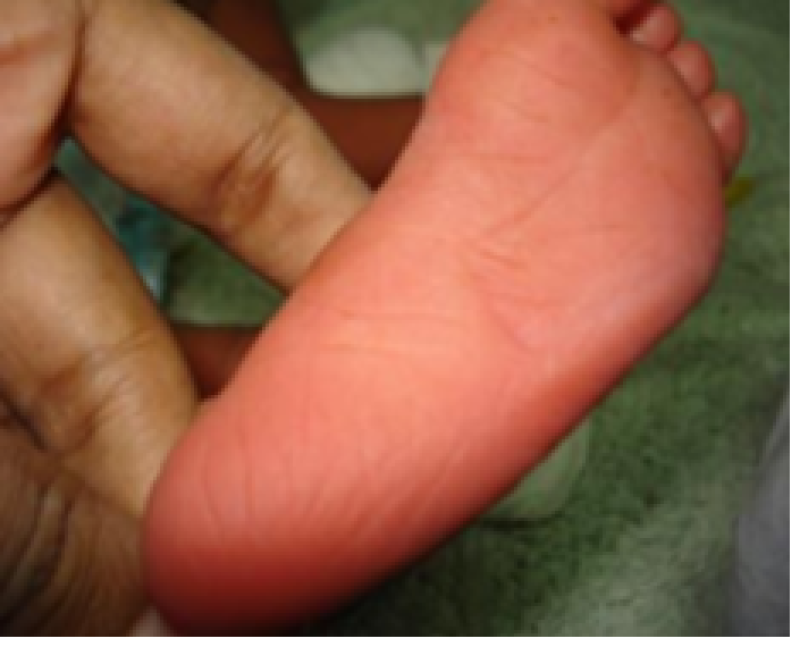
Figure 8: Term baby.

Figure 9: Preterm baby.
Breast size

Figure 10: Term baby.
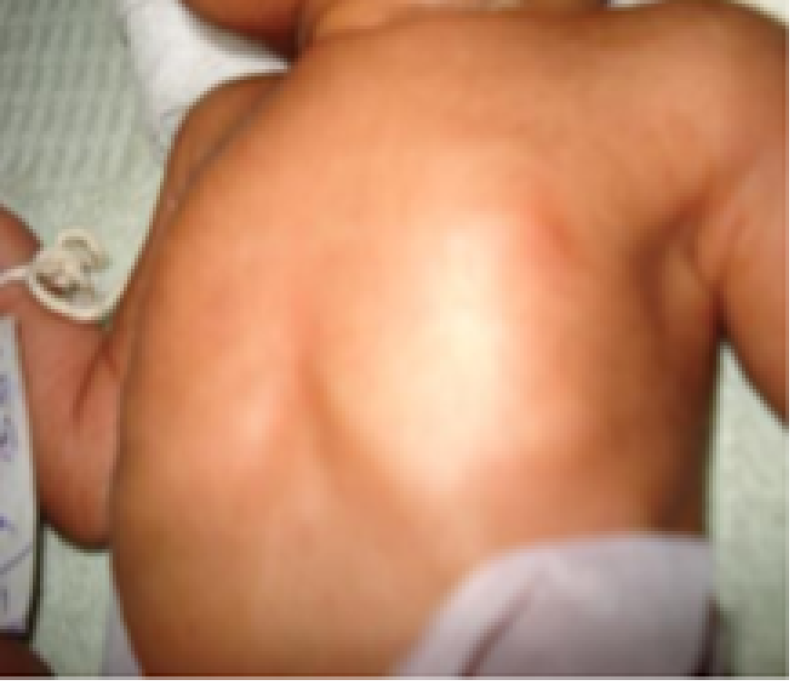
Figure 11: Preterm baby.
Ears
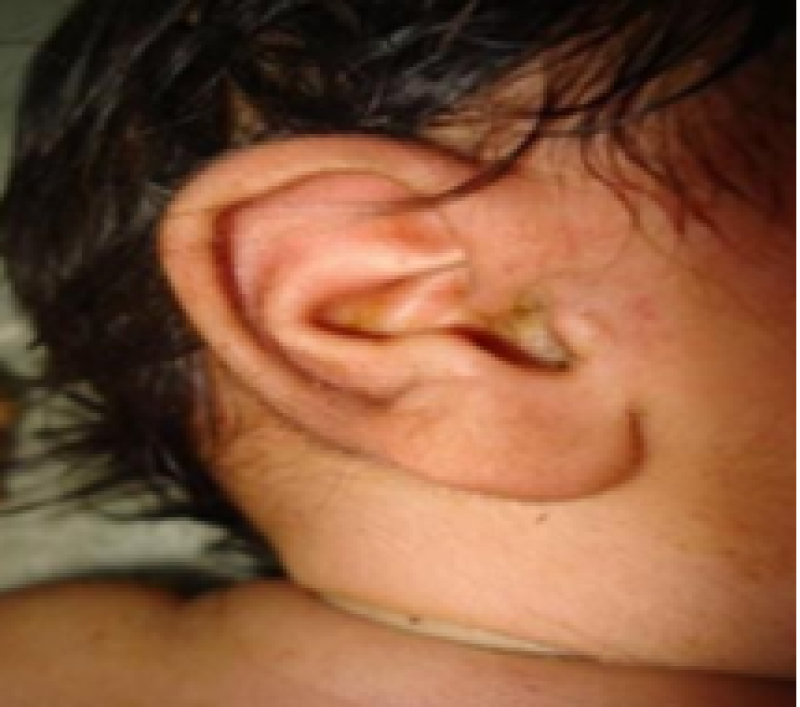
Figure 12: Term baby.
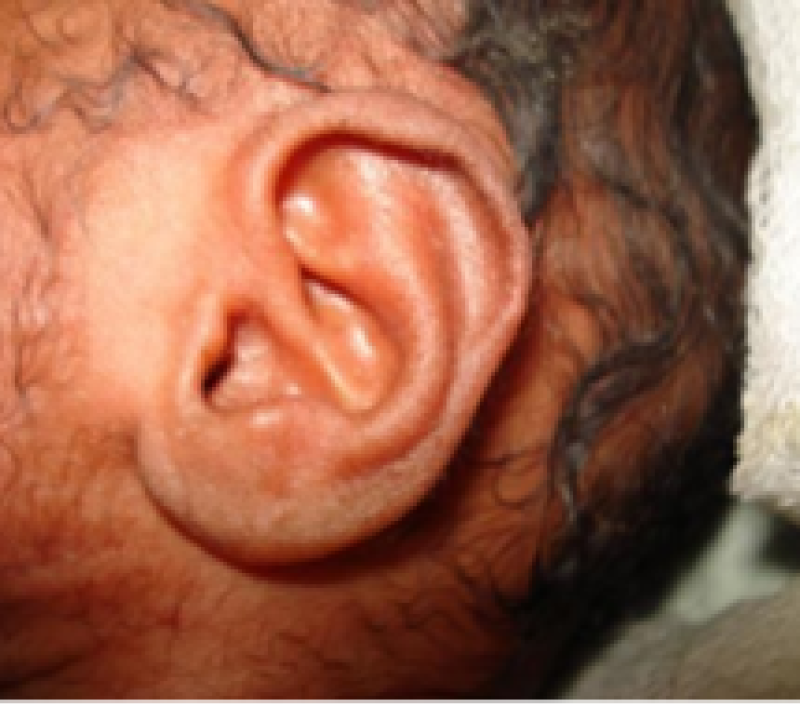
Figure 13: Preterm baby.
Genitals male

Figure 14: Term baby.
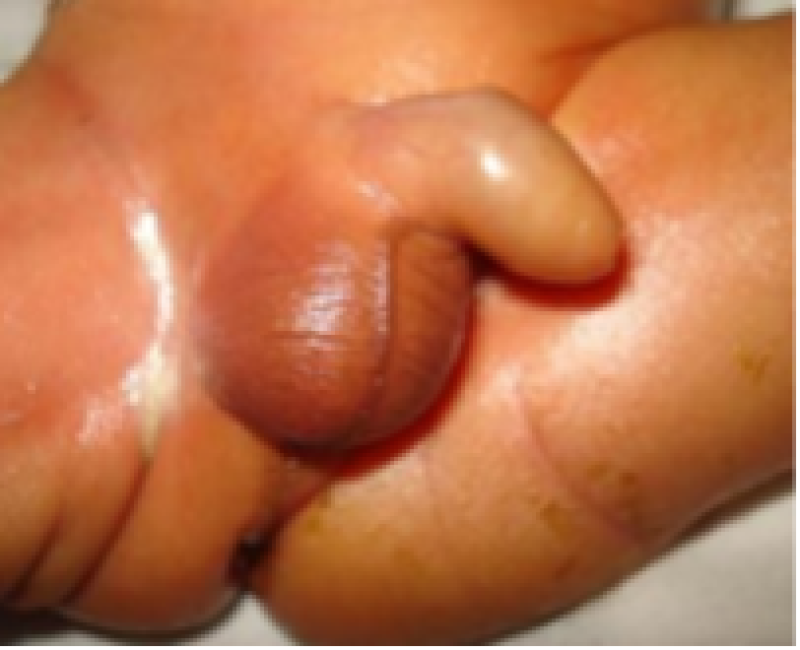
Figure 15: Preterm baby.
Genital female

Figure 16: Term baby.
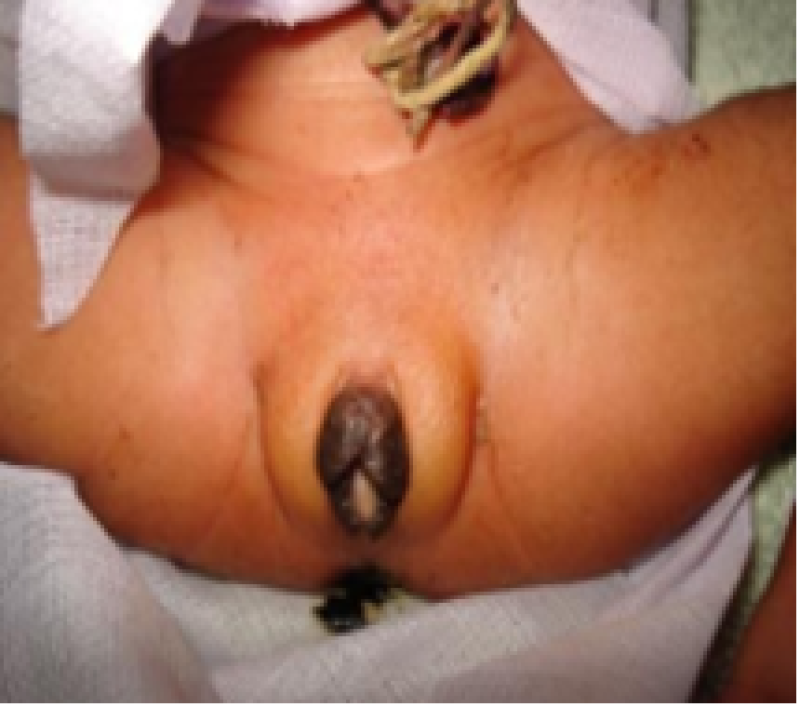
Figure 17: Preterm baby.
Scalp hair
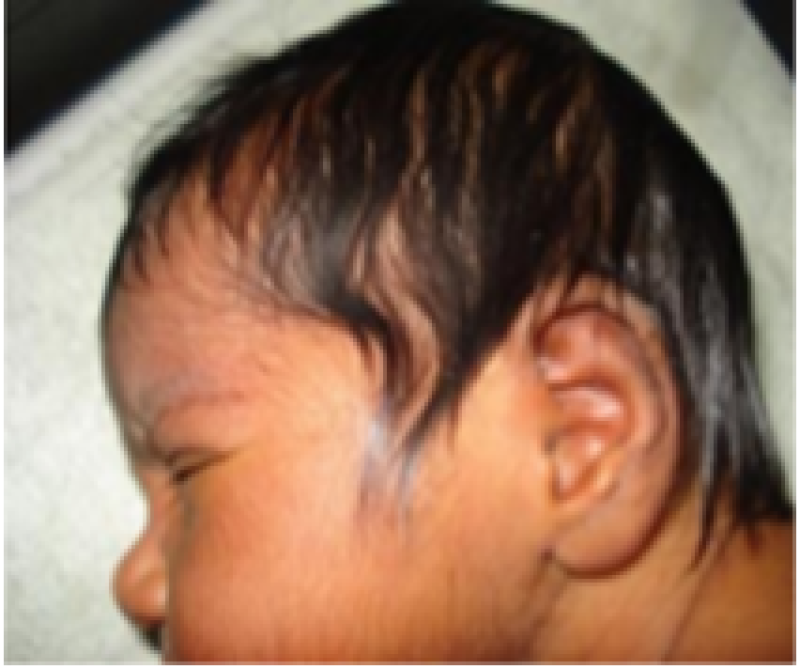
Figure 18: Term baby.
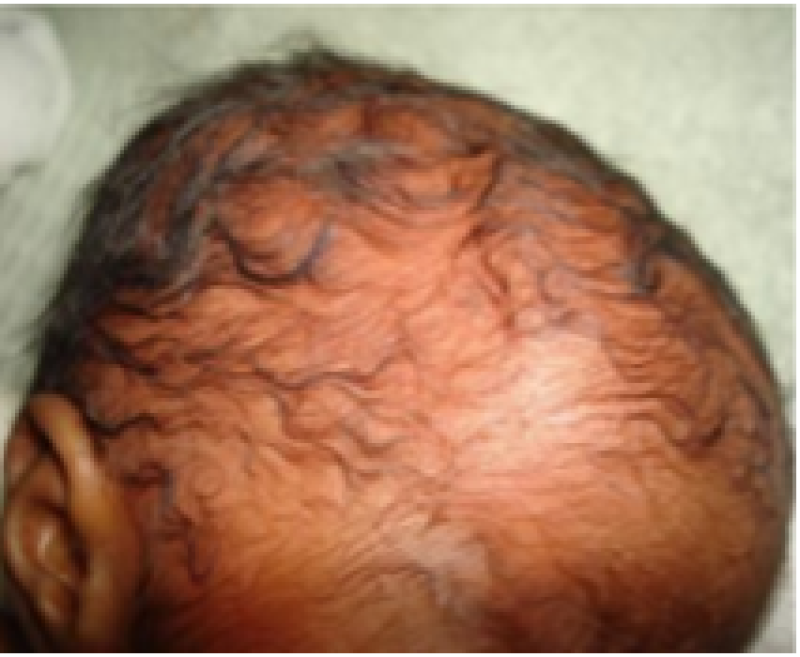
Figure 19: Preterm baby.
Neurological features posture
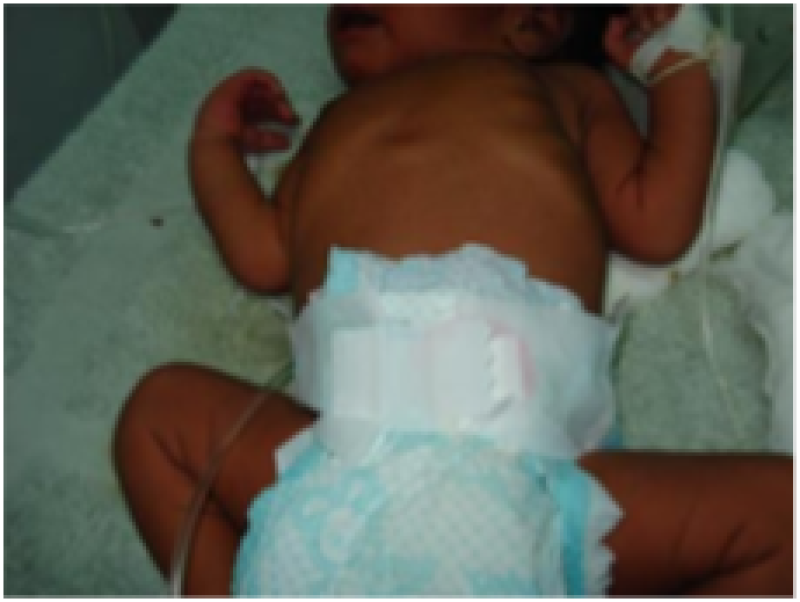
Figure 20: Term baby.

Figure 21: Preterm baby.
Square window

Figure 22: Term baby.

Figure 23: Preterm baby.
Armrecoil
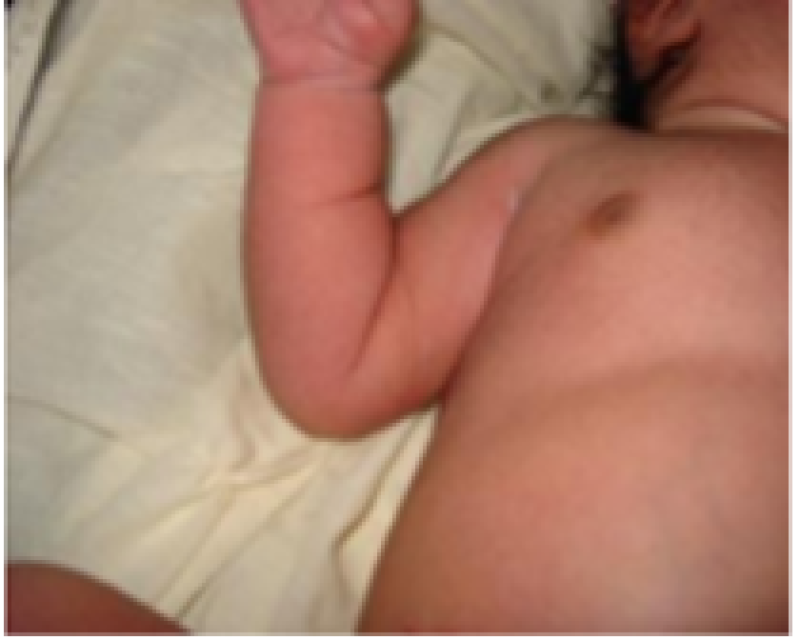
Figure 24: Term baby.

Figure 25: Preterm baby.
Poplitealangle
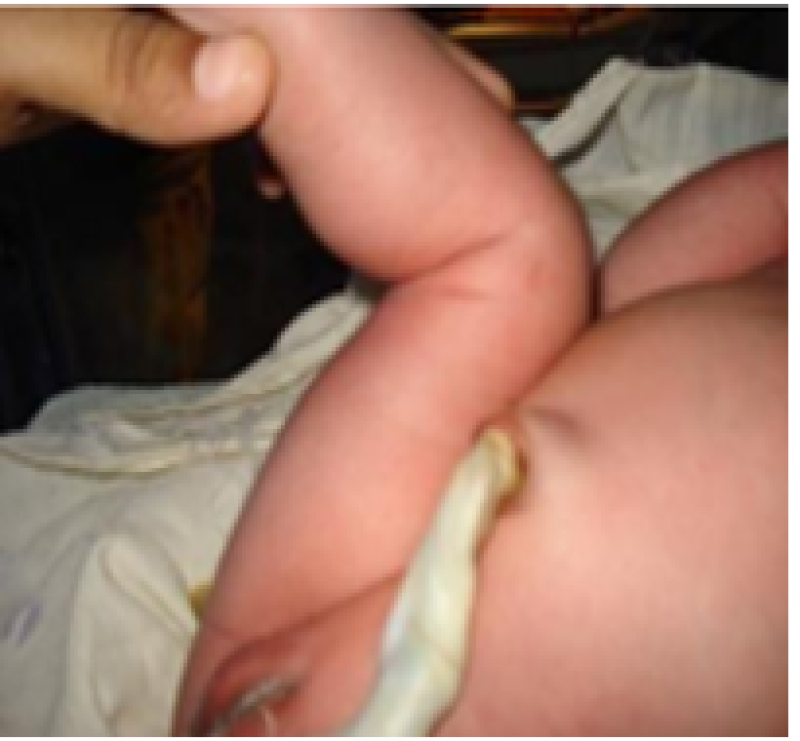
Figure 26: Term baby.
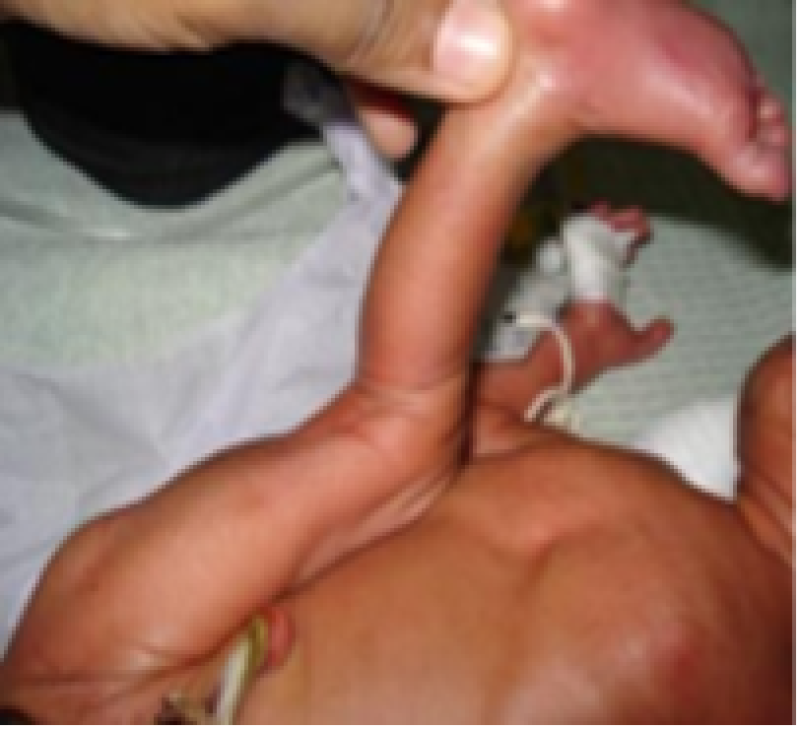
Figure 27: Preterm baby.
Scarf sign

Figure 28: Term baby.

Figure 29: Preterm baby.
Heel to ear
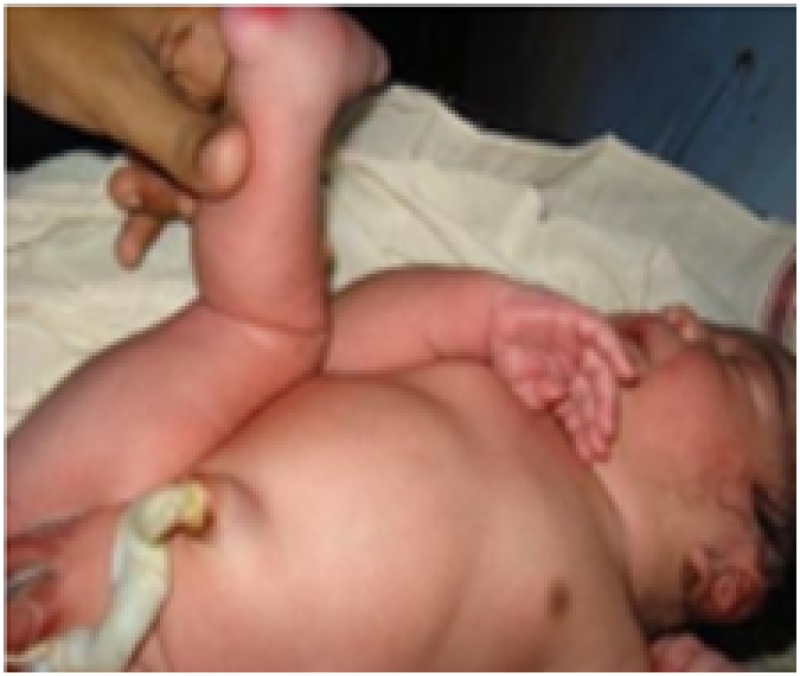
Figure 30: Term baby
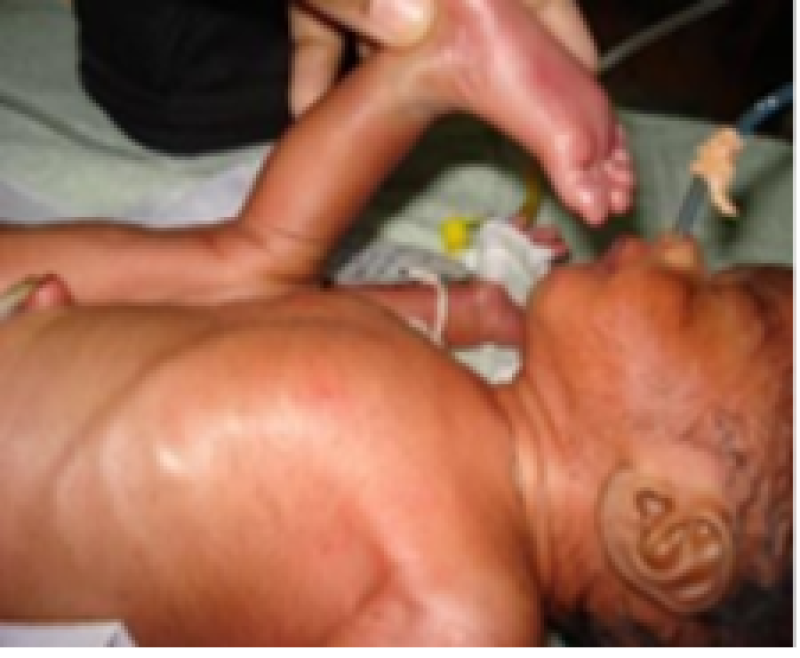
Figure 31: Preterm baby.
Materials and methods
Inclusion criteria
Inclusion criteria includes:
• Babies whose G.A. estimate is available by last menstrual period (LMP), and first-trimester ultrasonography scan will be included.
• Newborns admitted in Neonatal Intensive Care Unit (NICU) in the first 24 hours of life Newborns from gestational age 27-44 weeks.
Exclusion criteria
Exclusion criteria includes:
• Babies who cannot be examined within 24 hours of life will be excluded.
Data analysis and interpretation
The analysis and Interpretation of this study was based on the data collection. The results were compared with the help of descriptive and inferential statistics. The data were compared into excel sheets and analyzed by using STATA 14.1. Pearson correlation was calculated to know the degree of correlation between Parkin score and NBS. The descriptive data of both the scores were plotted in Bland Altman plot [15,20]. A probability of less than 0.05 was considered as significant.
| Gender | No. of subjects | Percentage |
| Male | 96 | 54.20% |
| Female | 81 | 45.80% |
| Total | 177 | 100% |
Table 3: Distribution of study subjects according to Gender.
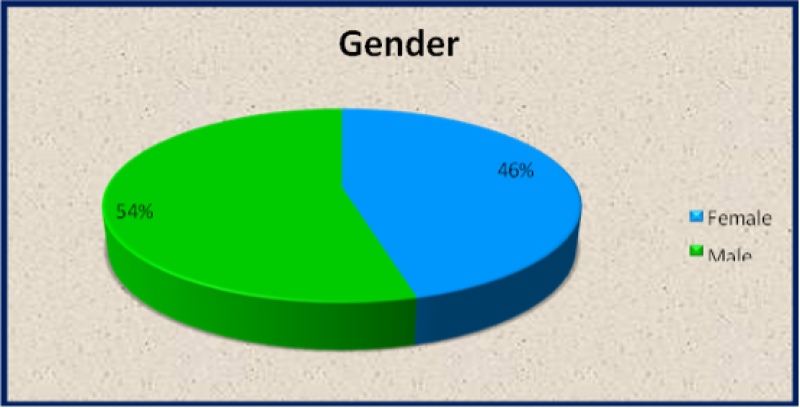
Figure 32: Distribution of study subjects according to Gender.
Gestational age
| Preterm | No. of subjects | Percentage |
| Preterm | 34 | 19.20% |
| Term | 142 | 80.20% |
| Post Term | 1 | 1% |
| Total | 177 | 100% |
Table 4: Distribution of study subjects according to Gestational Age. Out of 177 neonates, 34 preterm (19.2%), 142 term (80.2%) and 1 post term (0.6%) babies assessed.
Condition of newborn
| Neonate | No. of subjects | Percentage |
| Normal | 124 | 70.10% |
| Sick | 53 | 29.90% |
| Total | 177 | 100% |
Table 5: Distribution of study subjects according to condition of newborn.
Sickneonate
| Sickneonate | No. of subjects | Percentage |
| AOP | 1 | 1.90% |
| MAS | 9 | 16.90% |
| MSL | 1 | 1.90% |
| NNH | 6 | 11.30% |
| Perinatalasphyxia | 12 | 22.60% |
| Pretermcare | 2 | 3.80% |
| RDS | 12 | 22.60% |
| SEPSIS | 2 | 3.80% |
| TTNB | 8 | 15.10% |
| Total | 53 | 100% |
Table 6: Distribution of study subjects according to sickneonate.
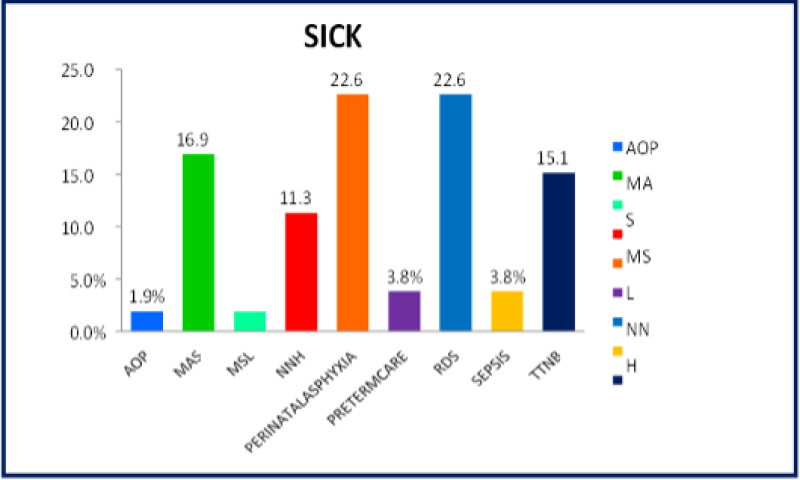
Figure 33: Distribution of study subjects according to sickneonate.
Birth weight
| Birth weight | No. of subjects | Percentage |
| <1.499 | 5 | 2.80% |
| 1.5-2.499 | 51 | 28.80% |
| >2.5 | 121 | 68.40% |
| Total | 177 | 100% |
Table 7: Distribution of study subjects according to Birth weight.
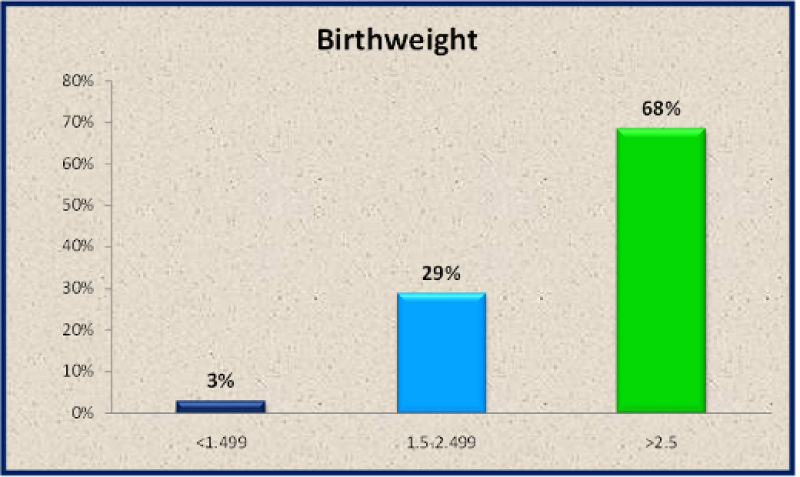
Figure 34: Distribution of study subjects according to Birth weight.
Gestational age based on LMP
| Gestational age based on LMP | No. of subjects | Percentage |
| <32 | 1 | 0.50% |
| 32-34 | 8 | 4.50% |
| 34-36 | 16 | 9.00% |
| 36-38 | 15 | 8.50% |
| 38-40 | 86 | 48.60% |
| >40 | 51 | 28.90% |
| Total | 177 | 100.0 |
Table 8: Distribution of Study Subjects According to Gestational Age based on Last Menstrual Period (LMP).
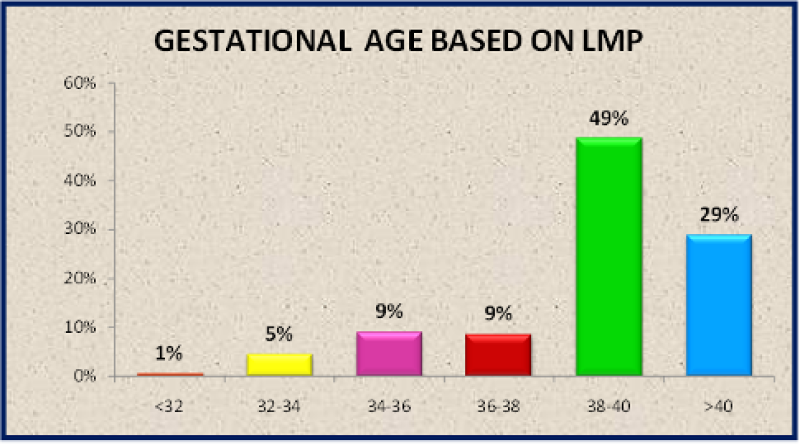
Figure 35: Distribution of study subjects according to Gestational Age based on LMP.
Gestational age based on expanded new ballard score
| Gestational Age based on ENBS | No. of subjects | Percentage |
| <32 | 1 | 0.50% |
| 32-34 | 11 | 6.20% |
| 34-36 | 16 | 9.00% |
| 36-38 | 31 | 17.50% |
| 38-40 | 90 | 50.80% |
| >40 | 28 | 15.80% |
| Total | 177 | 100.0 |
Table 9: Distribution of study subjects according to Gestational Age based on Expanded New Ballard Score (ENBS).
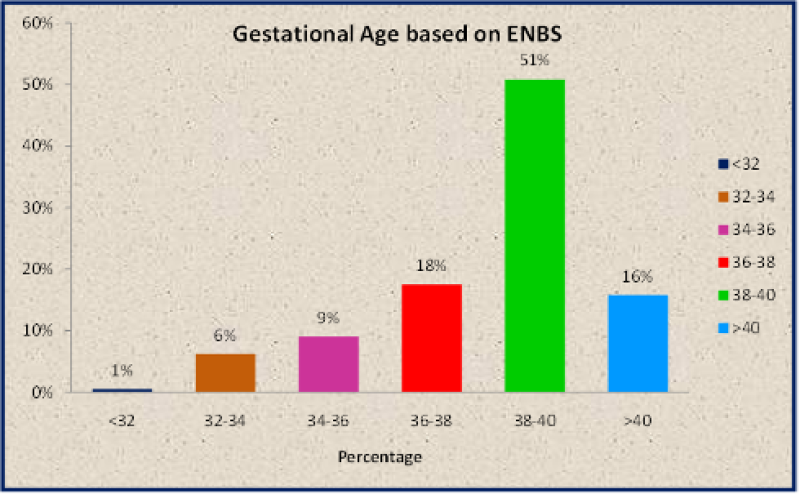
Figure 36: Distribution of study subjects according to Gestational Age based on ENBS.
Gestational age based on parkin score
| Gestational Age based on Parkin Score | No. of subjects | Percentage |
| <32 | 1 | 0.5% |
| 32-34 | 6 | 3% |
| 34-36 | 15 | 8.5% |
| 36-38 | 18 | 10.2% |
| 38-40 | 109 | 61.6% |
| >40 | 28 | 15.9% |
| Total | 177 | 100.0 |
Table 10: Distribution of study subjects according to Gestational Age Based on Parkin Score.
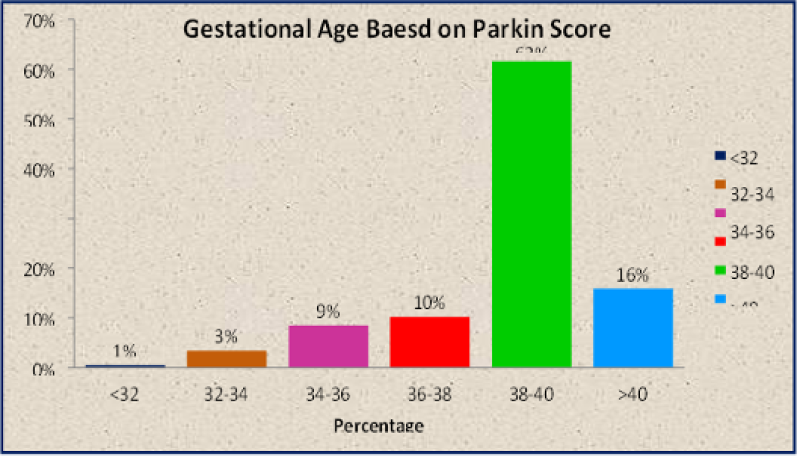
Figure 37: Distribution of study subjects according to Gestational Age Based on Parkin Score.
Time taken for ENBS vs PS
| Variable | Mean in seconds | SD in seconds |
| Time taken for assessment by ENBS | 274.1 | 59.8 |
| Time taken for assessment by PS | 88.9 | 18.1 |
Table 11: Time taken for assessment of gestational age by ENBS and PS.
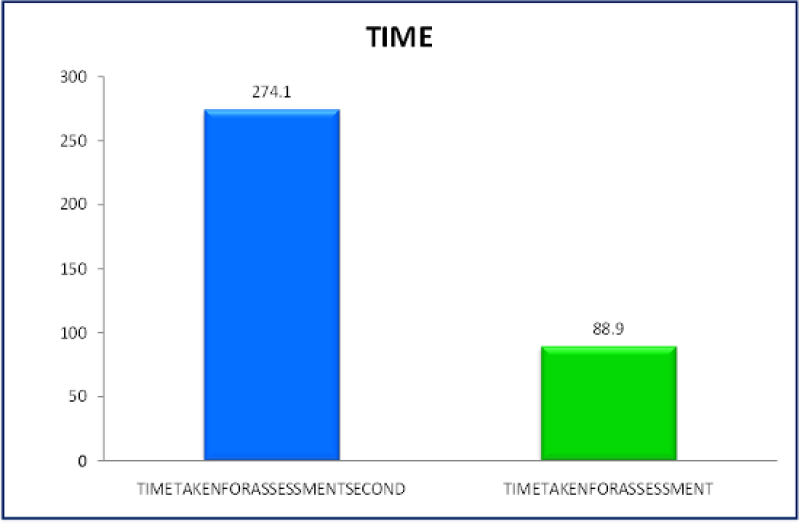
Figure 38: Time taken for assessment of gestational age by ENBS and PS. Mean time taken to assess ENBS was 274.1 seconds (4 min 34 secs), and PS was 88.9 seconds (1 min 29 sec). Time span taken for ENBS assorted from 253 seconds to 453 seconds. Time span for PS assorted from 84 to 151 seconds.
| Maturity | Gender | Χ2 value | p‟value” | |
| Male | Female | |||
| Preterm | 18(18.7) | 16(19.7) | 0.8668 | 0.648 |
| Term | 77(80.2) | 65(80.2) | ||
| Post term | 1(1.1) | 0(0) | ||
| Total | 96(100) | 81(100) |
Table 12: Distribution of Gender Based on Maturity. Figures in parentheses are percentage values.
| Gestational age | Gender | Χ2 value | p ‟value” | |
| Male | Female | |||
| SGA | 20(20.8) | 11(13.6) | 4.4365 | 0.109 |
| AGA | 73(76.1) | 70(86.4) | ||
| LGA | 3(3.1) | 0(0) | ||
| Total | 96(100) | 81(100) |
Table 13: Distribution of Gender Based on Gestational Age. Figures in parentheses are percentage values.
| Maturity | Neonate | Χ2 value | P ‟value” | |
| Normal | Sick | |||
| Preterm | 13(10.5) | 21(39.6) | 20.5545 | <0.001* |
| Term | 110(88.7) | 32(60.4) | ||
| Post term | 1(0.8) | 0(0) | ||
| Total | 124(100) | 53(100) |
Table 14: Distribution of Normal and Sick Neonates Based on Maturity. Figures in parentheses are percentage values.
| Gestational age | Neonate | Χ2 value | p‟value” | |
| Normal | Sick | |||
| SGA | 18(14.4) | 13(26.7) | 3.6849 | 0.158 |
| AGA | 104(84.1) | 39(71.1) | ||
| LGA | 2(1.5) | 1(2.2) | ||
| Total | 124(100) | 53(100) |
Table 15: Distribution of Normal and Sick Neonates Based on Gestational Age. Figures in parentheses are percentage values.
| Score | Mean | SD |
| LMP | 38.1 | 2.1 |
| ENBS | 38.8 | 2.1 |
| PS | 38.7 | 2.1 |
Table 16: Mean Gestational Age (Weeks) based on LMP, ENBS and PS.
| Scores | Normal newborn | Sick newborn | P value |
| LMP | 39.2 weeks | 37.5 weeks | <0.0001* |
| ENBS | 39.2 weeks | 37.6 weeks | <0.0001* |
| PS | 39.3 weeks | 37.7 weeks | <0.0001* |
Table 17: Mean Gestational Age (Weeks) based on LMP, ENBS and PS in Normal and Sick neonates. The mean GA Mean estimated by LMP is 38.1 weeks, for ENBS it is 38.8 weeks, for PS it is 38.7weeks.
Variable | Neonate | P Value | |
Normal Mean ± Sd | Sick Mean ± Sd | ||
| Gestational Age Based on Lmp | 39.2 ± 1.6 | 37.5 ± 2.6 | <0.0001* |
Table 18: Comparison of Gestational Age Based on LMP In Normal and Sick Neonates:(P<0.05* Statistically Significant).
Variable | Neonate | P Value | |
Normal Mean ± Sd | Sick Mean ± Sd | ||
| Gestational Age Based on ENBS | 39.2±1.7 | 37.6 ± 2.6 | <0.0001* |
Table 19: Comparison of Gestational Age Based on ENBS in Normal and Sick Neonates:(P<0.05* Statistically Significant).
Variable | Neonate | ||
Normal Mean ± Sd | Sick Mean ± Sd | P Value | |
| Gestational Age Based on Parkin Score | 39.3 ± 1.5 | 37.7 ± 2.8 | <0.0001* |
Table 20: Differentiate of Gestational age based on Parkin score in normal and sick neonates:(P<0.05* Statistically significant).
| PS | ENBS | |
| AGA | 9.1 days (1.3weeks) | 4.9 days (0.7 weeks) |
| LGA | 10.5 days (1.5 weeks) | 5.6 days (0.8 weeks) |
| SGA | 11.2 days (1.6 weeks) | 6.3 days (0.9 weeks) |
Table 21: Average variation in Gestational age based on birth weight and maturity.
| PS | ENBS | |
| Term | 8.4 days (1.2 weeks) | 4.2 days (0.6 weeks) |
| Preterm | 11.9 days (1.7 weeks) | 4.9 days (0.7 weeks) |
| Post term | 9.1 days (1.3 weeks) | 6.3 days (0.9 weeks) |
Table 22: Average variation in Gestational age based on maturity.
| Overall Average variation | |
| PS | 10 days (1.4weeks) |
| ENBS | 2days (0.7 weeks) |
Table 23: Median changes between PS and ENBS.
Overall, while taking birth weight from LMP into consideration, according to Parkin Score, the average variation from LMP was 1.3 weeks,1.5 weeks,1.6weeks for AGA, LGA and SGA newborns respectively. According to New Ballard Score, average variation from LMP was 0.7 weeks, 0.8 weeks, 0.9 weeks for AGA, LGA and SGA respectively.
Taking matureness into reflection as reported to PS, the median change from LMP was 1.7 weeks, 1.2 weeks, 1.3 weeks for Preterm, full term and post terms respectively. As stated by New Ballard score, average variations from Last Menstrual Period were 0.7 weeks (4.9days) for preterm, 0.6 weeks (4.2 days) for full term and 0.9 weeks (6.3 days) for post term respectively.
| Variable | Normal Babies | ||
| GA LMP | GA ENBS | GA PS | |
| GA LMP | 1 | 0.9316** | 0.8988** |
| GA ENBS | 1 | 0.9293* | |
| GA PS | 1 |
Table 24: Correlation in Normal Babies (n:124) :(Correlation is significant at the 0.01 level (2-tailed). *Correlation is significant at the 0.05 level (2-tailed).
| Variable | SICK neonates | ||
| GA LMP | GA ENBS | GA PS | |
| GA LMP | 1 | 0.9855** | 0.9678** |
| GA ENBS | 1 | 0.9776* | |
| GA PS | 1 |
Table 25: Correlation in SICK neonates(n:53): (Correlation is significant at the 0.01 level (2-tailed). *Correlation is significant at the 0.05 level (2-tailed).
| Variable | MAS | ||
| GA LMP | GA ENBS | GA PS | |
| GA LMP | 1 | 0.9911** | 0.9866** |
| GA ENBS | 1 | 0.9964* | |
| GA PS | 1 |
Table 26: Correlation in sick neonates with MAS(n:9): (Correlation is significant at the 0.01 level (2-tailed). *Correlation is significant at the 0.05 level (2-tailed).
| Variable | Perinatal asphyxia | ||
| GA LMP | GA ENBS | GA PS | |
| GA LMP | 1 | 0.9734** | 0.9712** |
| GA ENBS | 1 | 0.9946** | |
| GA PS | 1 |
Table 27: Correlation in sick neonates with NNH(n:6) :(Correlation is significant at the 0.01 level (2-tailed). *Correlation is significant at the 0.05 level (2-tailed).
| Variable | Perinatal asphyxia | ||
| GA LMP | GA ENBS | GA PS | |
| GA LMP | 1 | 0.9925** | 0.9786** |
| GA ENBS | 1 | 0.9728** | |
| GA PS | 1 |
Table 28: Correlation in sick neonates with Perinatal Asphyxia(n:12) :(Correlation is significant at the 0.01 level (2-tailed). *Correlation is significant at the 0.05 level (2-tailed).
| Variable | RDS | ||
| GA LMP | GA ENBS | GA PS | |
| GA LMP | 1 | 0.9614** | 0.9120** |
| GA ENBS | 1 | 0.8943** | |
| GA PS | 1 |
Table 29: Correlation in sick neonates with RDS(n:12) :(Correlation is significant at the 0.01 level (2-tailed). *Correlation is significant at the 0.05 level (2-tailed).
| Variable | TTNB | ||
| GA LMP | GA ENBS | GA PS | |
| GA LMP | 1 | 0.614 | 0.4064 |
| GA ENBS | 1 | 0.553 | |
| GA PS | 1 |
Table 30: Correlation in sick neonates with TTNB(n:8) :(Correlation is significant at the 0.01 level (2-tailed). *Correlation is significant at the 0.05 level (2-tailed).
| Variable | SGA | ||
| GA LMP | GA ENBS | GA PS | |
| GA LMP | 1 | 0.9735** | 0.9144** |
| GA ENBS | 1 | 0.9521* | |
| GA PS | 1 |
Table 31: Correlation in SGA neonates(n:33) :(Correlation is significant at the 0.01 level (2-tailed). *Correlation is significant at the 0.05 level (2-tailed).
| Variable | AGA | ||
| GA LMP | GA ENBS | GA PS | |
| GA LMP | 1 | 0.9601** | 0.9460** |
| GA ENBS | 1 | 0.9569* | |
| GA PS | 1 |
Table 32: Correlation in AGA neonates(n:143) :(Correlation is significant at the 0.01 level (2-tailed). *Correlation is significant at the 0.05 level (2-tailed).
| LGA | |||
| Variable | GA LMP | GA ENBS | GA PS |
| GA LMP | 1 | 0.9997* | 0.9529 |
| GA ENBS | 1 | 0.9449 | |
| GA PS | 1 |
Table 33: Correlation in LGA neonates(n:3) :(Correlation is significant at the 0.01 level (2-tailed). *Correlation is significant at the 0.05 level (2-tailed).
| Preterm | |||
| Variable | GA LMP | GA ENBS | GA PS |
| GA LMP | 1 | 0.9788** | 0.9334** |
| GA ENBS | 1 | 0.9527** | |
| GA PS | 1 |
Table 34: Correlation in PRETERM babies(n:34) :(Correlation is significant at the 0.01 level (2-tailed). *Correlation is significant at the 0.05 level (2-tailed).
| Term | |||
| Variable | GA LMP | GA ENBS | GA PS |
| GA LMP | 1 | 0.8858** | 0.8218** |
| GA ENBS | 1 | 0.8879** | |
| GA PS | 1 |
Table 35: Correlation in TERM babies(n:143) :(Similarity is crucial at the 0.01 level (2-tailed). *Similarity is crucial at the 0.05 level (2-tailed).
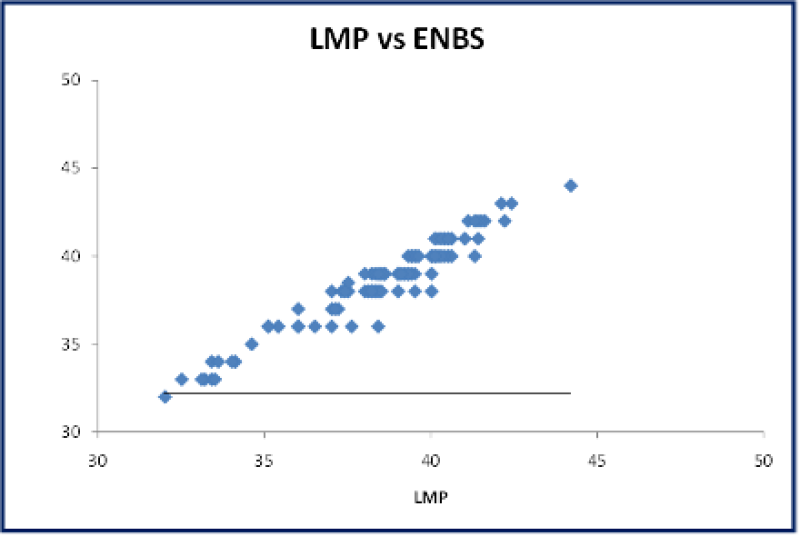
Figure 39: A Scatter plot: Correlation between gestational age assessment by LMP vs ENBS shows strong positive correlation.
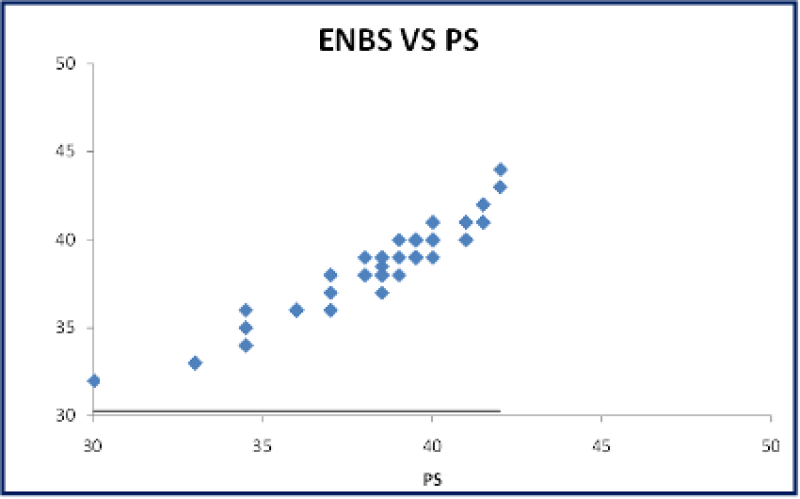
Figure 40: A Scatter plot: Correlation between gestational age assessment by LMP vs ENBS shows strong positive correlation.
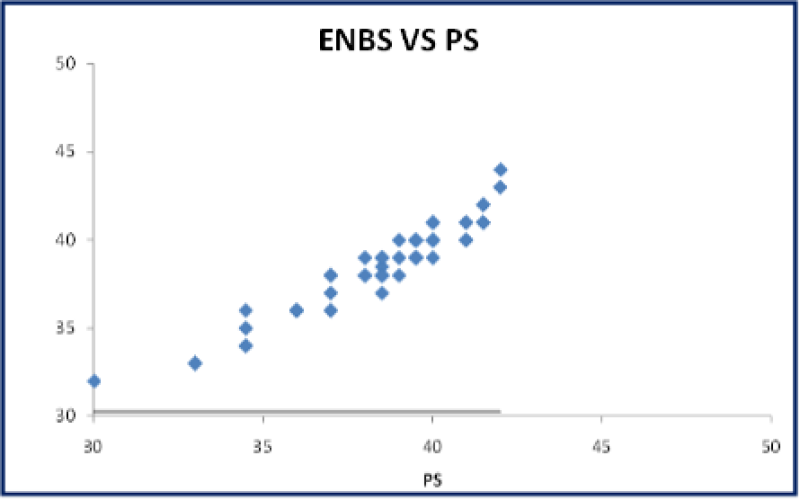
Figure 41: A Scatter plot: Correlation between gestational age assessment by ENBS vs PS shows strong positive correlation.
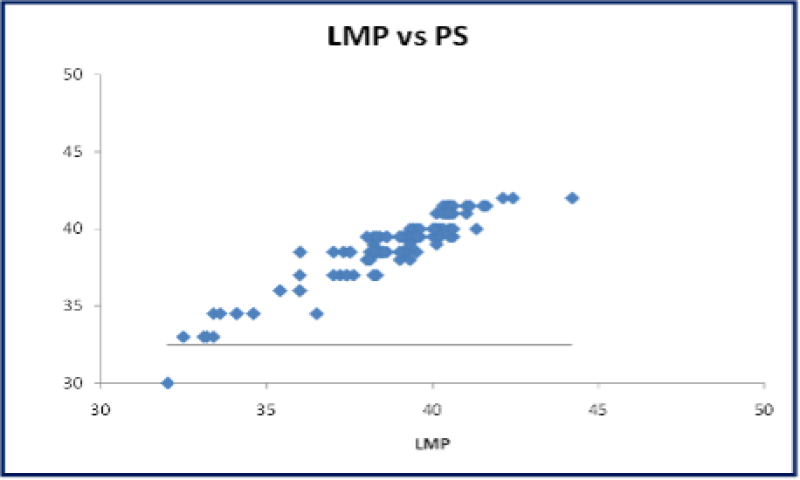
Figure 42: A Scatter plot: Correlation between gestational age assessment by LMP vs PS shows strong positive correlation.
Bland altman plot
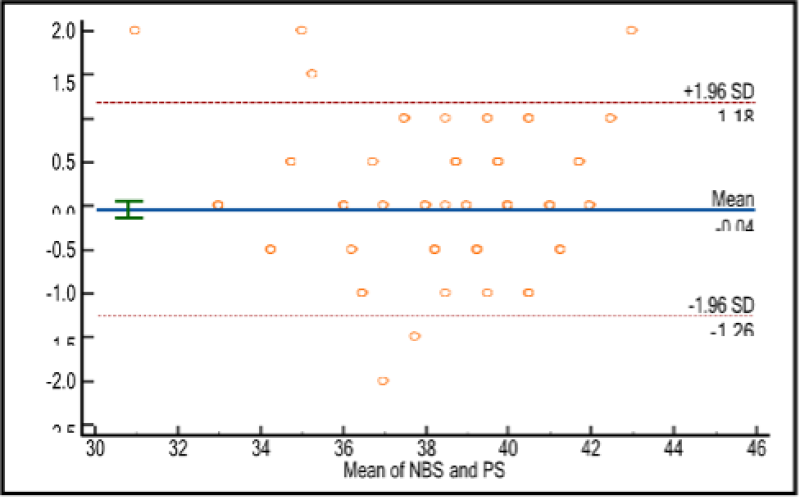
Figure 43: Bland Altman plot: The average and difference between the ENBS and PS along with the limits. Bland-Altman plot was plotted, and the mean difference was found to be-0.04 and most of the values are within SD was -/+ 1.96. The p value is <0.05 and it is strongly significant. It shows the two scores i.e., ENBS&PS were statistically important from each other in interpretation.
- For healthy newborns, the Pearson equivalence between ENBS and the GA calculated by LMP is 0.9316, while it is 0.8988 for Parkin score. There is a strong connection (p 0.05). Comparing GA estimated using ENBS and PS also revealed a strong positive association (0.9293).
- The Pearson correlation for ENBS with GA calculated by LMP and Parkin score (PS) for ill neonates is 0.9855 and 0.9678, respectively. There is a strong connection (p 0.05). Comparing GA estimated using ENBS and PS also revealed a strong positive association (0.9776).
- The Pearson correlation between ENBS and GA as determined by LMP is 0.921 for AGA infants and 0.785 for PS. There is a strong connection (p 0.05). Moreover, GA estimated with ENBS and PS were compared, and there was a good association (0.837).
- For LGA infants, Pearson correlation values for ENBS with GA calculated by LMP are 0.856 and 0.77, respectively. There is a strong connection (p 0.05). Also, the GA estimated with ENBS and PS were compared. A significant positive association was found (0.724).
- For SGA infants, the Pearson correlation between ENBS and LMP's GA estimation and PS is 0.789 and 0.521, respectively. There is a strong association (p value 0.05). Comparing GA determined using ENBS and PS, a positive association was found (0.612).
- For term infants, the Pearson correlation for ENBS with LMP's predicted GA is 0.936, and the correlation for PS is 0.825. Present association is quite significant (p value 0.05). Also, the GA computed by PS and ENBS were compared, and a good positive correlation (0.876) was found.
- For preterm babies, Pearson correlation for ENBS with GA estimated by LMP is 0.892 and with PS 0. 525.Strongly significant positive correlation present (p value <0.05). GA calculated using ENBS and PS were differentiated, and effective relationship seen (0.613).
Discussion
The accuracy of physical traits in contrast to neurological symptoms was evaluated by Parkin et al. in 1979. Ballards, et al. modified the dubowitz score in 1991 to accommodate extremely preterm newborns (ENBS). The GA estimate using ENBS and PS was compared in the current investigation, and it was found to have a significant, strong positive association. The duration of the study is a full year, and 177 babies in all were examined. The mass of the neonates analyzed scale from 750 g to 4200 g, with a mean of 2435.80 g. Due to covid limits, only 53 sick neonates out of 177 were investigated in the study, as opposed to 223 out of 500 newborns in Ravi Ambey, et al., [21].
Limitations of the study were due to the limited scope of study due to the comparison of the new Ballard score and Parkinscore for gestational age. Publication bias could be introduced as only 6 databases and 3 federal websites were used for the study.
Finally, research bias could also be introduced as the group that conducted the study was currently in pursuit of the healthcare system, thus viewing the study with research bias.
| Study | Age of examination | Mean age of examination |
| Present study | 0-24 hours | 14.9 hours |
| Ravi ambey et al. | 0-109 hours | 35.56 hours |
| Kavita Sreekumar et al. | 0-29 hours | 14.7 hours |
Table 36: Comparison of Age and Mean Age of Examination According to Other Studies.
This study assessed 53 newborns with co morbidities, with the most common co morbidities being respiratory distress syndrome and Hypoxic ischemic encephalopathy.
Gestational age was assessed by examination at a mean age of 14.9 hours to minimize errors due to advancing gestational age. In sick neonates having morbidities of MAS, HIE, RDS correlation done compared LMP with ENBS, PS, and Parkin score correlated significantly, but in TTNB babies scores not correlated. This research is same of research noticed by Indra et al.
| Study | Mean time for ENBS | Mean time for PS |
| Present study | 274.1 Seconds | 88.9 Seconds |
| Ravi ambey et al. | 320.62 Seconds | 95.92 Seconds |
Table 37: Comparison of Mean Time Taken for Enbs and Ps Acccording To Ravi Ambey et al.
According to study, Time was measured and listed taken for both examinations. Mean time taken to complete ENBS assessment was 274.1 seconds (4 min 34 secs) and Parkin score was 88.9 seconds (1min 29 sec). Range of time taken for ENBS varied from 253 seconds to 453 seconds. Range of time taken for PS varied from 84 to 151 seconds. This finding like that observed by Ravi Ambey et al [13].
| Study | Mga by Lmp/Usg | Mga by Enbs | Mga by Ps |
| Present study | 37.29 weeks | 37.35 weeks | 37.746 weeks |
| Ravi ambey et al. | 37.7 weeks | 37.6 weeks | 37.7 weeks |
| Kavita Sreekumar | 36.2 weeks | 36.1 weeks | 37.6 weeks |
Table 38: Comparison of Mean Gestational Age According to Different studies.
In my study, mean GA estimated by LMP/USG is 37.29 weeks, for ENBS it is 37.35 weeks, for PS it is 37.746 weeks. Mean difference between the two scores estimating GA was 3.9 days. In healthy infants the mean difference was 3.5 days. 4.1 days for unwell infants. According to Kavita Sreekumar et al., the mean GA by LMP was 36.2 weeks, by NBS was 36.1 and by PS was 37.6. According to Ravi Ambey et al., The mean GA as estimated by LMP was 37.7 weeks; by ENBS was 37.66 weeks; by PS was 37.7 weeks. Mean distinction among the 2 scores approximately GA was 3.75 days. In ordinary infants the distinction was 3.61 days and 3.7 days for ailing infants.
| Study | Average variation b/w Lmp and Ps in days |
| Present study | 10 days |
| Parkin et al., | 15 days |
| Sreekumar et al., | 12 days |
| Bela shah et al., | 10 days |
| Kanchan et al., | 12 days |
Table 39: Comparison of Average Variation in Days in Different Studies.
The median change from LMP to PS was 1.3 weeks, 1.5 weeks, and 1.6 weeks for AGA, LGA and SGA infant appropriately. New Ballard Score showed 0.7 weeks, 0.8 weeks, and 0.9 weeks for preterm, full term, and post term respectively. Pearson correlation for normal and sick neonates of PS with GA estimated by LMP/USG was 0.9316 for normal and 0.9855 for sick. Correlation between ENBS and PS was also compared, and a strong constructive correlation (p value <0.05) was observed.
For MAS, NNH, PA and RDS babies, Pearson correlation for PS with GA estimated by LMP/USG is 0.9866,0.9734,0.9925, 0.9735respectively. For AGA, LGA and SGA babies, the correlation is 0.8218, 0.9786, 0.9120 respectively. For TTNB babies, no correlation was found. ENBS with LMP is 0.9728,0.8943, and positive correlation 0.8879,0.9527 was observed among it.
The constant number of associations into Parkin Score and New Ballard is 0.89, according to Bela Shah et al. Ballard and LMP are correlated with a 0.95 coefficient, demonstrating its statistical significance and comparability.
Conclusion
Both the ENBS and the Parkin score are employed to determine the gestational age of newborns. In the current investigation, it was found that PS could estimate gestational age as accurately as ENBS using only physical criteria. When a baby is in an incubator or is ill, this procedure is quick, easy, and uncomplicated and does not cause the infant a lot of discomfort. The neonatal status, especially that of unwell neonates, is disturbed by ENBS since it is more thorough and takes longer. In environments with little resources and a low doctor-to-patient ratio, PS can be useful in accurately assessing GA. The health workers in outlying health care facilities can readily be trained due to its four simple components. The PS however cannot replace the ENBS in the hospital setup, particularly in the neonatal units.
References
1. Saint Anne Dargassies S. La Maturation Neurologique Du Prgmaturfi. Et Neonat. 1955;4:71-116. PubMed
2. Koenlgsberger MR. Judgment of fetal age. I. Neurologic Evaluation. Pediatr Clin Neurologic evaluation. 1966;13(3):823-33. PubMed | CrossRef
3. Ballard JL, Novak KK, Driver M. A Simplified Score for Assessing Fetal Maturation of Newly Born Infants. J Pediatr. 1979;95:769-74. PubMed | CrossRef
4. Ballard JL, Khoury JC, Wedig K, Wang L, EilersWalsman BL, Lipp R. New Ballard Score expanded to Include Too Premature Infants. J Pediatr. 1991;119(3):417-23. PubMed | CrossRef
5. Parkin JM, Hey EN, Clowes JS. Rapid Assessment of Gestational Age at Birth. Arch Dis Child. 1976;51(4):259-63. PubMed | CrossRef
6. Amiel Tison C. Neurological Evaluation of the Maturity of Newborn Infants. Arch Dis Child. 1968;43(227):89-93. PubMed | CrossRef
7. Wilkins-Haug L, Heffner LJ. Fetal Assessment and Prenatal Diagnosis. Man Neo Care. 5th ed. Philadelphia, Pa: Lippincott Williams & Wilkins. 2004:1-8.
8. Mujawar IJ, Somasetia DH, Effendi SH. The Conformity of New Ballard Score and Mother’s Last Menstrual Period in Term Infants Delivered with and Without Asphyxia. J Indonesian Medical Assoc. 2012;61.
9. Wariyar U, Tin W, Hey E. Gestational Assessment Assessed. Arch Dis Child Fetal Neonatal Ed. 1997;77(3):F216-20. PubMed | CrossRef
10. Goyal SC, Tak SK, Bhandari B. Determination of Gestational Age: Comparative Accuracy of Different Methods. Indian J Pediatr. 1989;56(1):115-9. PubMed | CrossRef
11. Scher MS, Martin JG, Steppe DA, Banks DL. Comparative Estimates of Neonatal Gestational Maturity by Electrographic and Fetal Ultrasonographic Criteria. Pediatr Neurol. 1994;11(3):214-8. PubMed | CrossRef
12. Dubowitz L, Ricciw D, Mercuri E. The Dubowitz Neurological Examination of the Full-term Newborn. Ment Retard Dev Disabil Res Rev. 2005;11(1):52-60. PubMed | CrossRef
13. Woods DL, Malan AF. Assessment of Gestational Age in Twins. Arch Dis Child. 1977;52(9):735-7. PubMed | CrossRef
14. Sreekumar K, d'Lima A, Nesargi S, Rao S, Bhat S. Comparison of New Ballards Score and Parkins Score for Gestational Age Estimation. Indian Pediatr. 2013;50(8):771-3. PubMed | CrossRef
15. Bland JM, Altman DG. Measuring Agreement in Method Comparison Studies. Stat Methods Med Res. 1999;8(2):135-60. PubMed | CrossRef
16. Capurro H, Konichezky S, Fonseca D, Caldeyro-Barcia R. A Simplified Method for Diagnosis of Gestational Age in the Newborn Infant. J Pediatr. 1978;93(1):120-2. PubMed | CrossRef
17. Hittner HM, Hirsch NJ, Rudolph AJ. Assessment of Gestational Age by Examination of the Anterior Vascular Capsule of the Lens. J Pediatr. 1977;91(3):455-8. PubMed | CrossRef
18. Lepley CJ, Gardner SL, Lubchenco LO. Initial Nursery Care: Assessment of Gestational Age. Handbook of Neonatal Intensive Care. 3rd ed. St. Louis: Mosby yearbook. 1993:76-99.
19. Alan Hill, MacDonald, Mhairi G Seshia, Mary MK, Mullett Marth D. Neurological and Neurological Disorders. Avery’s Neonatology, 6th Ed. Lippincott Williams and Wilkins. 2005;2955.
20. Bland M. An introduction to medical statistics. OUP. 1993;188-215.
21. Ambey R, Gogia P, Kumar AM. Comparison of Gestational Age Assessment by New Ballard Score and Parkin Score in Neonates. Int J Contemp Pediatr. 2018;5:1231-5.
Venugopal Reddy I1*, Pavan Kumar Yaramsetty2 and Vijayashankara CN3
1Medical Director and Consultant Paediatrician, Ovum Hospital, Bangalore, India
2Paediatrician, PES Medical College, Andhra Pradesh, India
3Professor of Paediatrics, PES Medical College, Andhra Pradesh, India
*Corresponding Author: Venugopal Reddy I, Medical Director and Consultant Paediatrician, Ovum Hospital, Bangalore, India.
Copyright© 2023 by Reddy VI, et al. All rights reserved. This is an open access article distributed under the terms of the Creative Commons Attribution License, which permits unrestricted use, distribution, and reproduction in any medium, provided the original author and source are credited.
Reddy VI, Yaramsetty PK, Vijayashankara CN. Neonates Extended New Ballard Score and Parkin Score Comparison for Gestational Age Assessment. Arch Clin Trial & Case Rep. 2023;2(1):143-174. DOI: https://doi.org/10.37191/Mapsci-ACTCR-2(1)-21